I presented some of the work on teaching algorithms and data structures at the 2018 European Lisp Symposium
Given that I wanted to go to the symposium (and I’m glad I did!), the most economical method for going was if I presented research work – because then there was a reasonable chance that my employer would fund the expenses (spoiler: they did; thank you!). It might perhaps be surprising to hear that they don’t usually directly fund attending events where one is not presenting; on the other hand, it’s perhaps reasonable on the basis that part of an academic’s job as a scholar and researcher is to be creating and disseminating new knowledge, and of course universities, like any organizations, need to prioritise spending money on things which bring value or further the organization’s mission.
In any case, I found that I wanted to write about the teaching work that I have been doing, and in particular I chose to write about a small, Lisp-related aspect. Specifically, it is now fairly normal in technical subjects to perform a lot of automated testing of students; it relieves the burden on staff to assess things which can be mechanically assessed, and deliver feedback to individual students which can be delivered automatically; this frees up staff time to perform targeted interventions, give better feedback on more qualitative aspects of the curriculum, or work fewer weekends of the year. A large part of my teaching work for the last 18 months has been developing material for these automated tests, and working on the infrastructure underlying them, for my and colleagues’ teaching.
So, the more that we can test automatically and meaningfully, the
more time we have to spend on other things. The main novelty here,
and the lisp-related hook for the paper I submitted to ELS, was being
able to give meaningful feedback on numerical answer questions which
probed whether students were developing a good mental model of the
meaning of pseudocode. That’s a bit vague; let’s be specific and
consider the break and continue keywords:
x ← 0
for 0 ≤ i < 9
  x ← x + i
  if x > 17
    continue
  end if
  x ← x + 1
end for
return x
The above pseudocode is typical of what a student might see; the
question would be “what does the above block of pseudocode return?”,
which is mildly arithmetically challenging, particularly under time
pressure, but the conceptual aspect that was being tested here was
whether the student understood the effect of continue. Therefore,
it is important to give the student specific feedback; the more
specific, the better. So if a student answered 20 to this question
(as if the continue acted as a break), they would receive a
specific feedback message reminding them about the difference between
the two operators; if they answered 45, they received a message
reminding them that continue has a particular meaning in loops; and
any other answers received generic feedback.
Having just one of these questions does no good, though. Students will go to almost any lengths to avoid learning things, and it is easy to communicate answers to multiple-choice and short-answer questions among a cohort. So, I needed hundreds of these questions: at least one per student, but in fact by design the students could take these multiple-chocie quizzes multiple times, as they are primarily an aid for the students themselves, to help them discover what they know.
Now of course I could treat the above pseudocode fragment as a
template, parameterise it (initial value, loop bounds, increment) and
compute the values needing the specific feedback in terms of the
values of the parameters. But this generalizes badly: what happens
when I decide that I want to vary the operators (say to introduce
multiplication) or modify the structure somewhat (e.g. by swapping
the two increments before and after the continue)? The
parametrization gets more and more complicated, the chances of (my)
error increase, and perhaps most importantly it’s not any fun.
Instead, what did I do? With some sense of grim inevitability, I
evolved (or maybe accreted) an interpreter (in emacs lisp) for a
sexp-based representation of this pseudocode. At the start of the
year, it's pretty simple; towards the end it has developed into an
almost reasonable mini-language. Writing the interpreter is
straightforward, though the way it evolved into one gigantic case
statement for supported operators rather than having reasonable
semantics is a bit of a shame; as a bonus, implementing a
pretty-printer for the sexp-based pseudocode, with correct indentation
and keyword highlighting, is straightforward. Then armed with the
pseudocode I will ask the students to interpret, I can mutate it in
ways that I anticipate students might think like (replacing continue
with break or progn) and interpret that form to see which wrong
answer should generate what feedback.
Anyway, that was the hook. There's some evidence in the paper that the general approach of repeated micro-assessment, and also the the consideration of likely student mistakes and giving specific feedback, actually works. And now that the (provisional) results are in, how does this term compare with last term? We can look at the relationship between this term’s marks and last term’s. What should we be looking for? Generally, I would expect marks in the second term’s coursework to be broadly similar to the marks in the first term – all else being equal, students who put in a lot of effort and are confident with the material in term 1 are likely to have an easier time integrating the slightly more advanced material in term 2. That’s not a deterministic rule, though; some students will have been given a wake-up call by the term 1 marks, and equally some students might decide to coast.
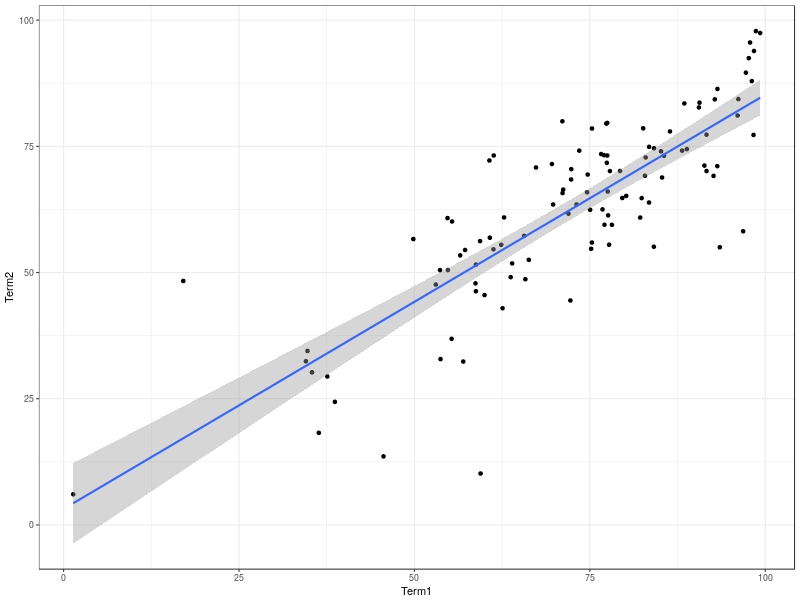
I’ve asked R to draw the regression line in the above picture; a straight line fit seems reasonable based on the plot. What are the statistics of that line?
R> summary(lm(Term2~Term1, data=d))

Call:
lm(formula = Term2 ~ Term1, data = d)

Residuals:
        Min      1Q  Median      3Q     Max
    -41.752  -6.032   1.138   6.107  31.155

Coefficients:
Estimate Std. Error t value Pr(>|t|)
(Intercept)  3.18414    4.09773   0.777    0.439
Term1        0.82056    0.05485  14.961   <2e-16 ***
---
Signif. codes:  0 ‘***’ 0.001 ‘**’ 0.01 ‘*’ 0.05 ‘.’ 0.1 ‘ ’ 1

Residual standard error: 10.46 on 107 degrees of freedom
  (32 observations deleted due to missingness)
Multiple R-squared:  0.6766,    Adjusted R-squared:  0.6736
F-statistic: 223.8 on 1 and 107 DF,  p-value: < 2.2e-16
Looking at the summary above, we have a strong positive relationship between term 1 and term 2 marks. The intercept is approximately zero (if you got no marks in term 1, you should expect no marks in term 2), and the slope is less than one: on average, each mark a student got in term 1 tended to convert to 0.8 marks in term 2 – this is plausibly explained by the material being slightly harder in term 2, and by the fact that some of the assessments were more explicitly designed to allow finer discrimination at the top end – marks in the 90s. (A note for international readers: in the UK system, the pass mark is 40%, excellent work is typically awarded a mark in the 70% range – marks of 90% should be reserved for exceptional work). The average case is, however, only that: there was significant variation from that average line, and indeed (looking at the quartiles) over 50% of the cohort was more than half a degree class (5 percentage points) away from their term 2 mark as “predicted” from their mark for term 1.
All of this seems reasonable, and it was a privilege to work with this cohort of students, and to present the sum of their interactions on this course to the audience I had. I got the largest round of applause, I think, for revealing that as part of the peer-assessment I had required that students run each others’ code. I also had to present some of the context for the work; not only because this was an international gathering, with people in various university systems and from industry, but also because of the large-scale disruption caused by industrial action over the Universities Superannuation Scheme (the collective, defined benefit pension fund for academics at about 68 Universities and ~300 other bodies associated with Higher Education). Perhaps most gratifyingly, students were able to continue learning despite being deprived of their tuition for three consecutive weeks; judging by their performance on the various assessments so far,
And now? The students will sit an exam, after which I and colleagues will look in detail at those results and the relationship with the students’ coursework marks (as I did last year). I will continue developing this material (my board for this module currently lists 33 todo items), and adapt it for next year and for new cohorts. And maybe you will join me? The Computing department at Goldsmiths is hiring lecturers and senior lecturers to come and participate in research, scholarship and teaching in computing: a lecturer in creative computing, a lecturer in computer games, a lecturer in data science, a lecturer in physical and creative computing, a lecturer in computer science and a senior lecturer in computer science. Anyone reading this is welcome to contact me to find out more!